What is a sound field?
A sound field is the technical name given to the dispersion of sound energy within given boundaries. In our situation of architectural acoustics, the boundaries are the walls, floor, and ceiling of a room.
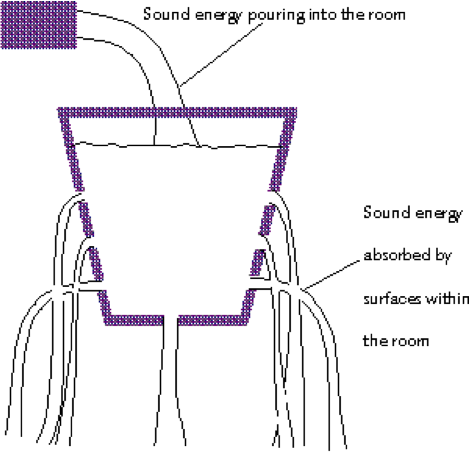
Figure 16: A sound field is like the water in a leaky bucket
When loudspeakers pump sound energy into a room, the sound starts to bounce around within the room and very rapidly, something called a reverberant field is achieved. This is a steady state situation where the rate at which sound energy is being lost is exactly balanced by the rate at which the loudspeakers add energy.
A good way of understanding this steady state phenomenon is to think of what happens if you were to pour water into a leaky bucket. If the holes in the bucket were only small, then the water would leak out slowly, and pouring the water in too fast would cause the bucket to overflow. On the other hand, if the holes were large, then the water would leak out as fast as you poured it in.
When the rate at which the water is poured into the bucket matches the rate at which the water leaks out, then the water level remains constant, and a steady state has been achieved.
This is very much like what happens when you put sound energy into a room. If the sound energy dies away at the same rate as the loudspeakers are adding it, then the overall reverberant field remains steady.
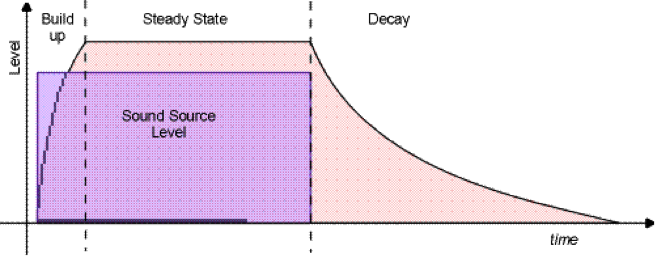
Figure 17: Volume levels in a reverberant field
Another property of a steady state sound field is that its volume level is always slightly greater than the volume level being pumped into the room by the speakers. The reason for this is that once a reverberant field has been achieved, the volume level will be the sum of the instantaneous energy being added by the speakers, and the energy from the echo of the earlier sounds.
Energy distribution within a sound field
From an acoustical point of view, it is very important that the energy within a sound field is evenly distributed.
In physics, a sound field in which the energy is perfectly distributed is known a diffuse field. If such a field were to exist in reality, then there would be an equal amount of energy flowing in all directions at all locations within the room. If you were to take a sound level meter into such a room, it would not matter in which direction you pointed it, it would always give the same reading.
However, in reality, this situation can never be achieved – but it can be approached.
The sound field created by a loudspeaker
As an aside, the energy from a loudspeaker forms its own sound field known as the speaker’s “direct field”. If you are sitting in the direct field of a loudspeaker, then your perception of the sound in the room will be completely dominated by that which comes directly from the speaker. It will effectively drown out reflected sounds arriving from other parts of the room.
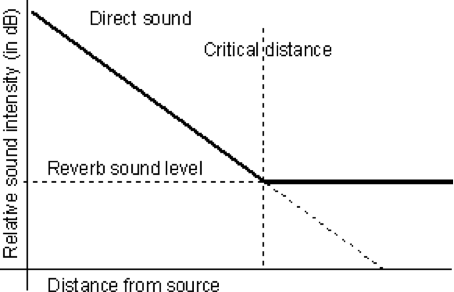
Figure 18: Loudspeaker’s cut off distance within a reverberant field
However, as you move further away from loudspeaker, you will reach a boundary distance where the volume of sound from the loudspeaker’s direct field has dropped sufficiently that you become aware of the general reverberant field in the room.
When designing an audio control room, it is important to know what the critical distance is from your loudspeakers. If
you sit too far away from the speakers, you hear more “room” sound than direct speaker sound. This in
turn, could alter your perception of the sound’s timbre and overall quality.

Equation 10: A loudspeaker’s critical distance
Where Q is the directivity of the speaker, A is the total surface area of the room and “α bar” is the average absorbency of the entire room.
Later on, will look at how the absorbency of a room is calculated.
Resonant modes
Every room has a set of frequencies at which it will naturally resonate. These special frequencies are often referred to as “resonant modes”, but the technical name is eigenmodes (“eigen” is the German word for “particular” or “distinct”). They occur because of the constructive interference that happens when the wavelength of a sound is some even multiple of one or more of the room dimensions.
If you’re one of those people who sing in the shower, then you will probably have noticed that when you hit certain notes, they sound louder than others. What you have discovered is one of the resonant modes (or eigenmodes) of your bathroom. The notes that match the resonant frequencies of the room sound louder than non-resonant notes because of constructive interference.
Resonant modes can behave in three different ways (in a rectilinear room):
- Axial Modes
- An axial mode is the simplest type of mode, and describes the resonance that occurs between a single pair of opposing surfaces in a room, E.G. the floor and ceiling.
- Axial modes are the easiest to hear and make a strong contribution to the overall resonant field. This is because they require the fewest number of reflections.
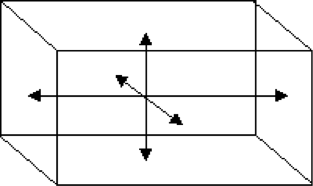
Figure 19: Axial modes
- Tangential Modes
- A tangential mode occurs between two pairs of surfaces. In this situation, the sound bounces between any four surfaces of the room, E.G. a pair of walls and the floor and ceiling, or all four walls.
- Since a tangential mode requires a higher number of reflections, they do not make as strong a contribution to the overall resonant field as axial modes.
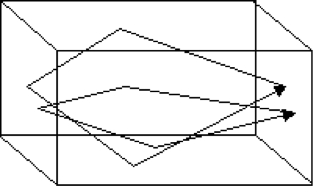
Figure 20: Tangential modes
- Oblique Modes
- An oblique mode occurs when sound resonates around all six surfaces of the room.
- Typically, an oblique mode will make a very small contribution to the overall resonant field.
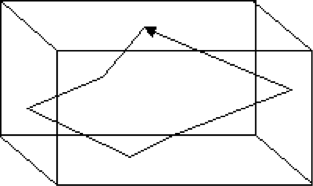
Figure 21: Oblique modes
All rooms (particularly rectilinear rooms) will resonate at certain frequencies. This effect does not cause a problem in your bathroom, but can be a significant problem in an auditorium or a control room where music is to be mixed. In these situations, room resonances produce an effect known as “colouration”.
Colouration creates the perception that certain frequencies in music or speech are too loud. This is not because the music has been performed or mixed badly, but rather because the frequencies at which the room naturally resonates are amplified due to constructive interference. This effect is simply a consequence of the room’s geometry. Unfortunately, many people fail to realise that the problem is the room, not the music!
From a post-production point of view, any music mixed in a control room that exhibits significant colouration will sound very poor when played outside that room. This is due to the fact that in order to produce a balanced mix in that room, you have to adjust the EQ of the music to compensate for the effects of colouration.
Now play this music in another room that does not exhibit the same colouration, and you will hear “holes” or “gaps” in the frequency range where you compensated for your room’s colouration.
The net result is that your mix will not travel well — and that is bad news for anyone in the music business.
Mode Orders
Modes also have a property known as their “order”. The simplest (or first order) axial mode occurs when one of the room dimensions is exactly half the wavelength of a frequency in the sound field.
All the room modes can be calculated up to any order you choose using the equation below. However, as the mode order rises, so the contribution the mode makes to the overall sound field becomes smaller and smaller. For practical purposes, it is usually not necessary to calculate modes higher than the eighth order.

Equation 12: Calculating a mode frequency
Resonant modes are calculated with equation 12:
Where f is the frequency of the particular mode, V is the velocity of sound (343.25 m/s), L, W, and H are the length, width, and height of the room in metres, and p, q, and r are integers that describe the order of a particular mode.
For example, to calculate the first axial mode that runs down the length of the room, we are not interested in what happens along the width or height of the room, therefore the values for q and r can be set to zero. This has the effect of switching off the width and height terms of the equation. p is then set to 1 because we want to calculate the first order mode.
Extending this principle, if you wanted to calculate the second order tangential mode that resonates between the two long walls, and the floor and the ceiling, we would be interested in the width and height, but not along the length. So p would be set to 0, and q and r would be set to 2.
This equation is used (in a simplified form) to calculate the lowest mode of a room. This is the lowest frequency at which resonance can occur in the room. Below this frequency, resonance is not possible because the wavelength of sound is simply too big to fit within the dimensions of the room.

Equation 13: Lowest mode frequency
The lowest mode will always be a first order axial mode and will occur between the pair of surfaces that are farthest apart; so one of the values p, q, and r will be set to 1 and the remaining two values will be set to 0. Which ones are set to 0 depends on which is the longest dimension. Equation 12 can now be simplified to what you see in equation 13:
Sound is a wave, right?
Yes—but also no! In its simplest form, sound is a transfer of energy by means of a rapid succession of longitudinal waves.
At higher frequencies, sound behaves much like a ray of light in that it obeys the laws of reflection, diffraction, and refraction. This is due to the fact the wavelength of the sound is several orders of magnitude smaller than the distance travelled by the sound.
In this higher frequency range, when sound hits a hard surface it obeys the law of reflection, bouncing off at the same angle it arrived. This is a characteristic behaviour of ray-like propagation.
Low frequency sounds however, are far more unruly! In the lower end of the acoustic spectrum, the behaviour of sound becomes much more complex. Remember that a decrease in frequency corresponds to an increase in wavelength. This in turn means that as the frequency drops, the wavelength rises to the point that it becomes a significant proportion of room’s dimensions.
As you go down the frequency range, the wavelength will eventually grow to a size at which it quite literally, no longer “fits” in the room (remember how the calculation for a room’s lowest mode works).
Why is it important to understand this change in behaviour?
For sounds that have a wavelength significantly smaller than the room dimensions, the phase relationship between two such sounds is insignificant. At this higher frequency range, the sound field is dominated by ray-like behaviour.
However, as the wavelength increases, the phase relationship between sound waves becomes significant. Now the sound field is dominated by wave-like behaviour. This means that we must start to account for constructive and destructive interference, which in turn, will create standing waves and nulls at various places in the room.
At low frequencies, we do not need to be concerned with the effects of refraction or diffusion, but we are very concerned about the effects of standing waves, and constructive and destructive interference.
The sound field in a room
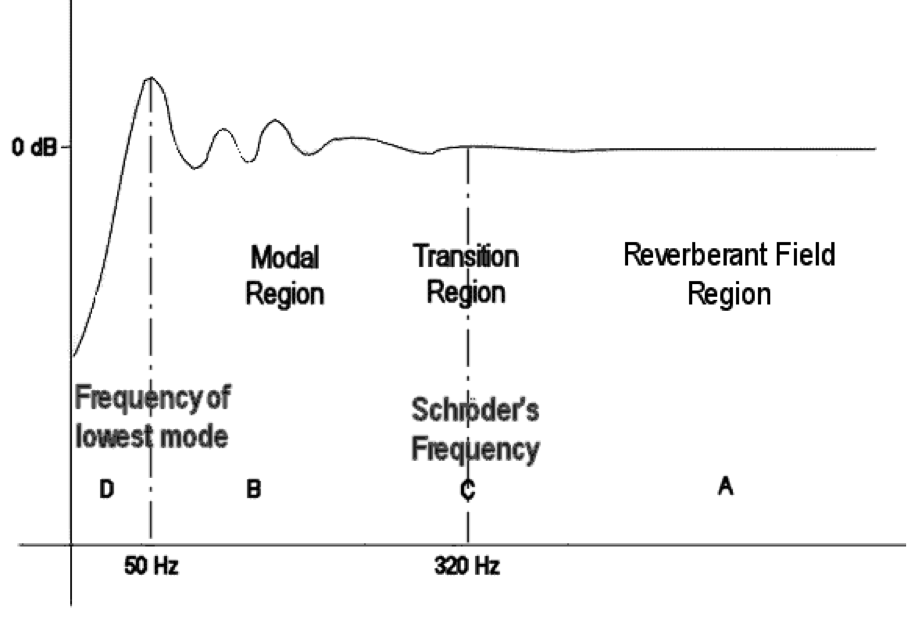
Figure 22: Frequency regions within the sound field of a specific room
Unfortunately, there is no distinct cut-off point to indicate when sound stops behaving like a ray and starts behaving like a wave. Instead, every room has a set of frequency ranges in which one type of behaviour is more prevalent than another. There is also a complicated frequency range right in the middle where both wave-like and ray-like behaviour occur.
In Figure 22 above, the wavelength of the sound in region A is of sufficiently small compared to the dimensions of the room that sounds behave like rays.
In region B, the wavelength of the sound is sufficiently large compared to the dimensions of the room that the sound behaves like waves. Phase relationships between individual waves govern the behaviour of the sound field in this region.
At the bottom end of the scale is region D. No resonance can occur below this cut-off frequency because the room is not large enough to accommodate half a wavelength. The boundary of region D is well defined.
Lastly, region C is known as the transition region. It contains modal frequencies that behave both as rays and as waves, and consequently, the behaviour of sound in this region is difficult both to predict and manage. The midpoint of this region can be calculated quite easily (marked by the line through C), but you should always bear in mind that sound in this region moves smoothly from wave-like behaviour at the bottom end, to ray like behaviour at the top end.
Every room has a different set of frequency bands in which this behaviour is observed. Do not think that the figures quoted in Figure 22 are common to all rooms! These boundaries vary depending on the room’s dimensions and acoustic characteristics.
Behaviour of sound in the transition region

Equation 14: Schröder frequency equation
Since the frequency range known as the transition region contains sounds that are difficult to manage, it has been an area of active research. One such researcher is Manfred Schröder working at the University of Göttingen in Germany. He devised a formula for working out an effective midpoint within this transition region. This midpoint is known as Schröder’s critical frequency, or simply, Schröder’s Frequency.
In practical terms, this frequency can be used as the upper limit for the wave-like effects of resonance and phase interaction within a room.
Minimising room resonance
The sound that is heard in a listening room is determined by the combined effect of the electronics of the audio system, the physical acoustics of the listening environment and the geometry of the room. The sound quality can vary significantly depending on the relative positions of the listener and loudspeakers, and the room geometry.
Resonant modes in small rooms often lead to colouration, that is, uneven frequency responses and extended decay times of certain frequencies. Indeed, these modes can be so influential that they dominate the sound. Low frequency modes are particularly noticeable because there tend to be large frequency gaps between adjacent modes.
Control room designers have long tried to overcome the problems of colouration by choosing an appropriately proportioned room, by placing the listeners and loudspeakers in suitable positions, and by using bass absorbers.
The first problem then is choosing the right ratio of room dimensions.
Rather than specifying exact dimensions, listening rooms are described in terms of the ratio of their length to width to height. The smallest room dimension (typically height) is set to 1, and then the length and width are expressed as ratios of the height. In this manner, only two values need be quoted.
Many attempts have been made to define ranges of room ratios in which the modal spacing is considered acceptable. The ratios defined by Richard Bolt are probably the most widely used:


Equation 15: Bolt’s recommended room ratios
Where x and y are the ratios of the room dimensions. Width, height and length are related by 1:x:y, but the order is not important.
The EBU has published their set of acceptable ratios as:


Equation 16: EBU recommended room ratios
Also, the IEC has its set of acceptable ratios:

Equation 17: IEC recommended room ratios
The EBU and IEC ratio ranges are defined such that the worst cases are eliminated.
L. W. Sepmeyer also defined a set of ratios, but narrowed it down to three specific ratios. These are known as Sepmeyer’s Golden Ratios.
| 1 | 1.14 | 1.39 |
| 1 | 1.28 | 1.54 |
| 1 | 1.60 | 2.33 |
Table 2: Sepmeyer’s Golden Ratios
Prof Trevor Cox of Salford University has done extensive research in this area, and has produced the following detailed diagram to show how bass resonance changes as the ratio of length to width to height changes. The light areas denote strong bass resonance and the dark areas weak bass resonance. As you can see, there are very few room ratio combinations that exhibit the desired level of weak bass resonance.
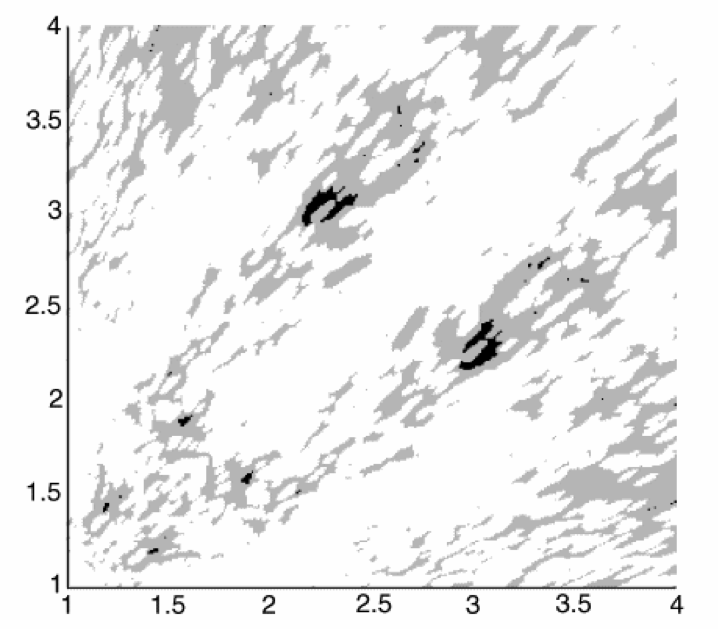
Figure 23: Bass response of various room ratios (© University of Salford, UK)